AI work · Experiment 01 · 5 October 2026
Excel to PowerPoint Automation: Updating a Recurring Report with AI
Update an existing monthly PowerPoint from new Excel data, preserve the approved template and editable charts, and check the saved result. Unsupported commentary stays marked for human review.

The Skill works directly in Codex with its bundled document tools. Relay is optional for retained jobs, review receipts and continuation. Use it in Codex →
I tested a reusable AI Skill on that exact task: turn a January report into a February report, keep the six-slide template, and check the saved file against the source data.
The result passed an independent review: 31 mapped numeric targets, three editable charts and eight period labels matched their sources. One missing explanation remained explicitly marked for human input.
There was preparation involved. We created the template, defined the metrics and supplied a mapping. This was a bounded test with actual historical transactions, rather than a claim that an agent can update any company's deck without setup.
Get the Skill and the worked example →
Start with the report you already have
A recurring report mixes several kinds of content. Some stays fixed: slide layout, typography, labels and the structure of the story. Other content changes each month: KPIs, product rankings, chart series and the reporting period.
Those two kinds of content need different treatment. Asking an agent to “make a sales presentation” leaves room for a redesign. Asking it to update a supplied report, with an explicit source map, gives it a checkable task.
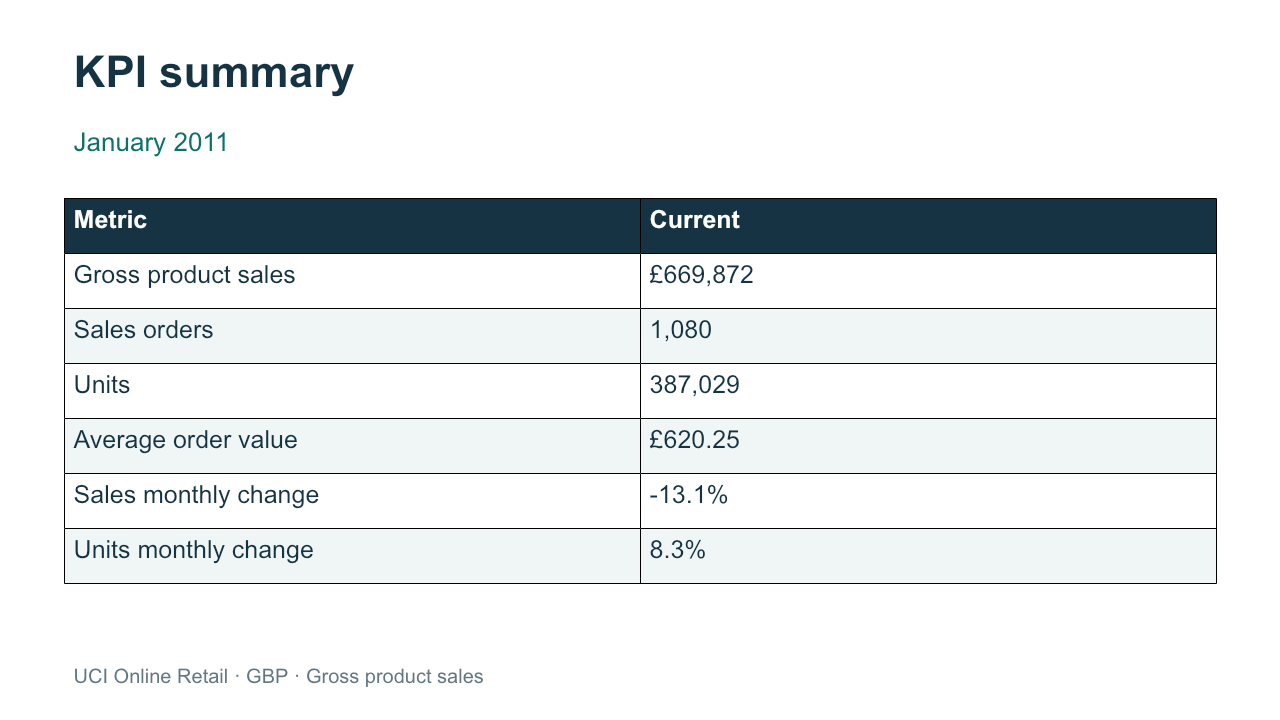
For this trial, the inputs were a January workbook, a February workbook, a six-slide January PowerPoint template, and a mapping that connected workbook cells to table cells, chart points and date labels. We also supplied the metric policy and left the cause-explanation field blank.
Use real data and define the calculation
The transactions came from UCI's Online Retail dataset, published by Daqing Chen. UCI describes it as transactions from a UK online retailer between December 2010 and December 2011, with unit prices in sterling. It is available under CC BY 4.0.
We selected January and February 2011, plus December 2010 for the trend. That gave us 105,335 source rows. Before relying on the derived workbooks, we compared every selected row's original fields against the untouched source XLSX.
Our metric was gross product sales: positive quantity, positive unit price, a product code matching the declared rule, and an invoice that was not a cancellation. Each line was rounded to pennies, then summed. Eligible rows with a missing customer ID stayed included. Cancellations and other excluded rows remained documented in the source policy.
This is our reproducible calculation policy, not an audited revenue definition supplied by UCI. Net sales or another business definition would require a different policy and fresh checks.
Make the procedure reusable
The Skill keeps the procedure separate from a particular month's files. Its instructions are to preserve the template, validate the source fields, update every mapped value and chart dataset, and report missing evidence instead of inventing it.
The mapping holds the report-specific choices: which worksheet to use, which cell contains the period, where each KPI appears, and which cells supply chart categories and values. You pay that setup cost once for a stable report. If the report or workbook structure changes, the map needs another review.
The portable object is a folder with SKILL.md and supporting scripts, following the Agent Skills format. The published v1 adapter also ran unchanged directly in Codex desktop with its bundled spreadsheet/presentation tools, without Relay. The separately saved output passed the same 31 numeric, three chart and eight period-label checks. We inspected all six previews. No dependencies were installed. This checks the supplied adapter and mapping; automatic Skill discovery and a CLI without document tools were not tested. Other hosts may implement the same procedure, but I have not verified this adapter in Claude or OpenClaw.
Give the agent the Skill and the selected files, then use a request like this:
Update the existing monthly PowerPoint report from the February workbook.
Preserve the supplied January template and layouts. Replace all mapped
period-specific values, chart series, categories and period labels.
Verify the saved deck against the workbook and the source policy.
Keep native chart data editable. Report anything that cannot be mapped
confidently. Leave the unsupplied cause explanation as human input
required. Save to a new output path.
The example includes those files and a ready-made mapping. To use your own report, start by reviewing its cells, units and slide targets. A missing required number should block the export; an optional explanation can be left as an explicit question for the reviewer.
Run it and review a separate output
I used Task Relay's production runtime through its local command line to freeze the inputs, run a configured Codex producer, and pass the saved outputs to a separate independent reviewer. Both workers completed on their first attempt. No execution correction or retry was needed.
This was a file-and-shell job using the supplied Skill and adapter. It does not demonstrate a ready-made, one-click Desktop feature for arbitrary presentation templates.
The producer updated the February numbers, rebuilt the editable chart snapshots and returned the deck with a receipt and six previews. The reviewer independently recalculated the source rows and checked the actual saved XLSX/PPTX files, chart caches, embedded workbooks and template signatures.
| Check | Observed result |
|---|---|
| Mapped numeric targets | 31 of 31 matched their sources |
| Editable chart datasets | 3 of 3 complete caches and embedded workbooks matched |
| Period labels | 8 of 8 updated |
| Saved slide layout and style | No differences detected under the declared comparison |
| Missing explanation | 1 field marked for human input |
The 31-target count includes mapped table values and raw chart points. It is not an OCR check of every visible axis tick. The layout comparison covers the saved six-slide template's geometry and style, with documented equivalent defaults; it is not a promise of identical rendering in every presentation app.
Do not turn a numeric change into a cause
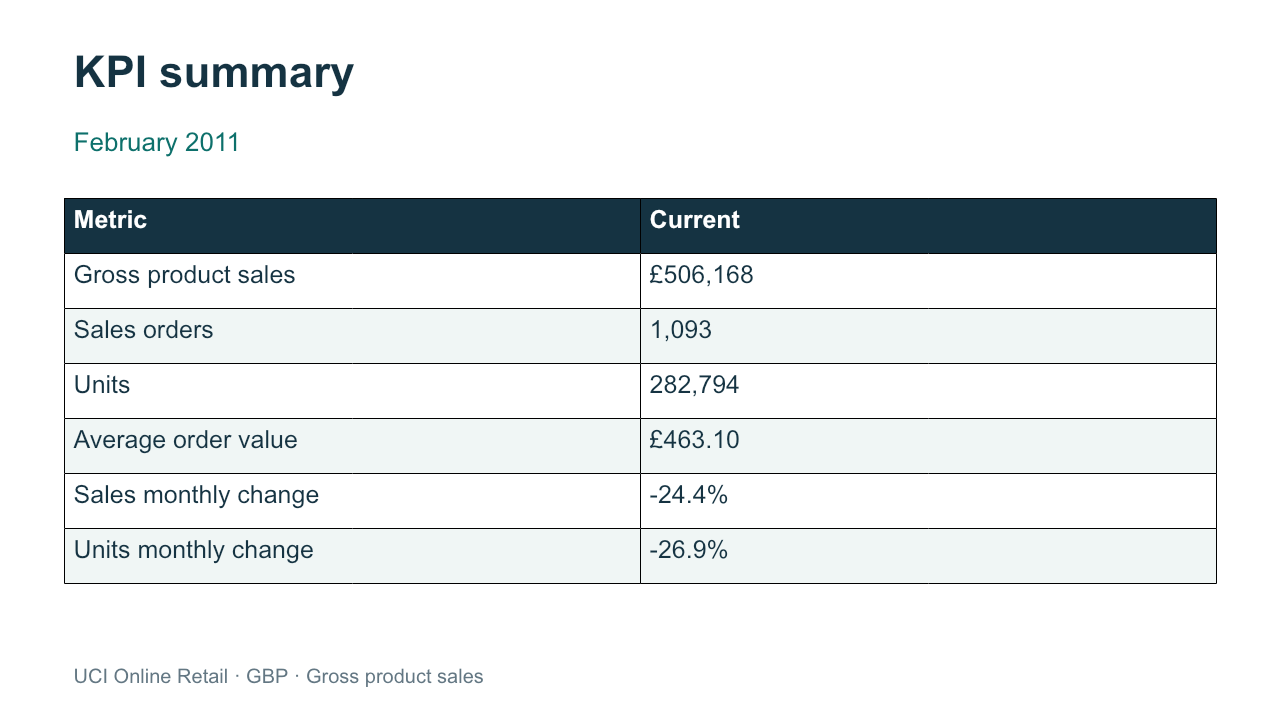
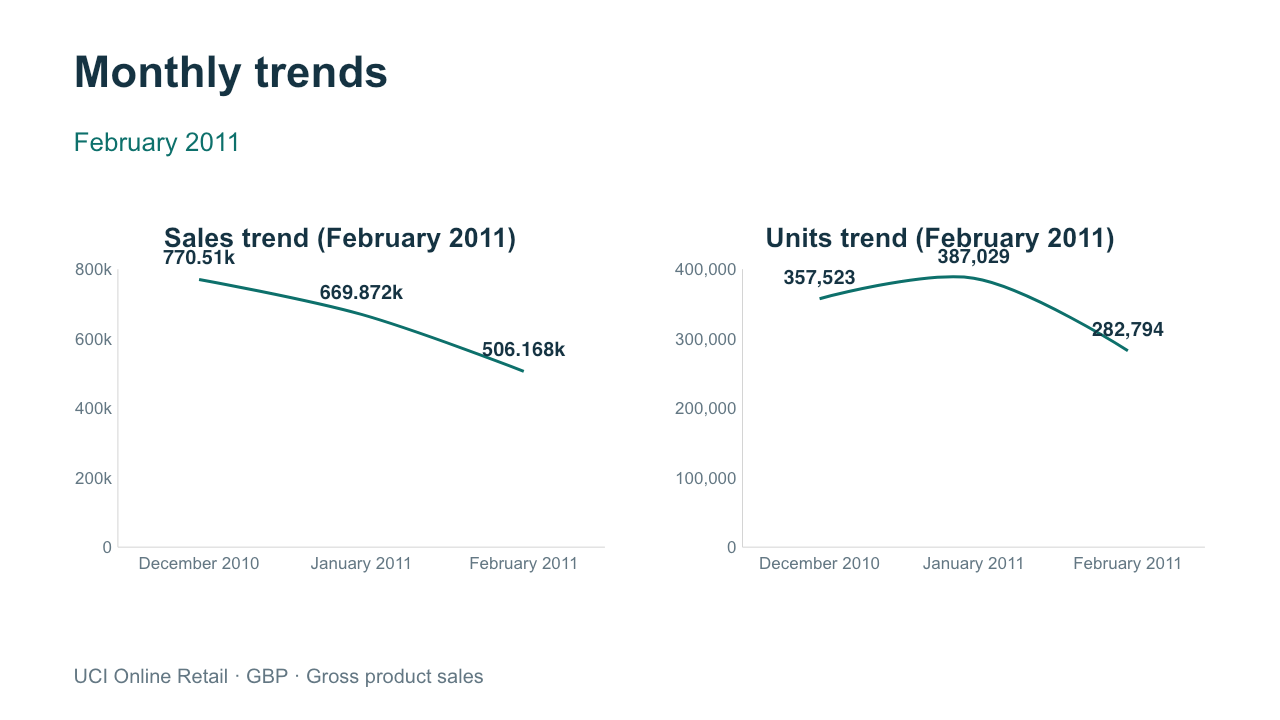
Under the declared policy, February gross product sales were £506,167.81, down 24.4% from January. Eligible orders were 1,093 and units were 282,794.
Those figures do not explain why sales changed. No approved cause statement was supplied, so the final slide retained: “Human review: no approved explanation supplied.” A report that makes this gap visible is easier to review than one that fills it with a plausible story.
I also opened the exact output in Keynote and inspected all six slides. They were readable, but Keynote changed chart number formatting and thin table borders, and briefly showed a missing-font warning. PowerPoint itself was not tested. Open the file in the application you intend to use before treating the result as finished.
Try the example before your own report
Download the Skill and the January-to-February example →
The example includes the two workbooks, the January template, the source policy, the mapping and the checked February output. The Skill contains no publisher execution-reporting endpoint. Website download counts can show interest in the example; they cannot prove that someone used the Skill or installed Relay.
Relay is useful when you want frozen input versions, a separate reviewer and retained execution receipts. You can also use the Skill's procedure directly with an agent that has suitable spreadsheet and presentation tools. The included reference adapter needs the host-provided dependencies described in the download.
This run provides a concrete example with real transaction data. It does not establish customer adoption, arbitrary-template reliability or a measured time saving. The next test is whether readers find the problem useful enough to try the reusable procedure.
Data attribution: Chen, D. (2015). Online Retail. UCI Machine Learning Repository. doi:10.24432/C5BW33, CC BY 4.0. Changes: selected December 2010–February 2011, calculated declared aggregates, and created our own template and updated report. Public verification summary.